
Building a multivariate hypergeometric calculator with Lark and SymPy
In science, sampling and games of chance we want to calculate the probability of picking certain items, at random, from some larger collection. For example:
Draw 7 cards from a standard deck of 52 cards. What’s the probability we see 2 or more of the 4 kings in the draw?
If we assume that each item in the collection has an equal probability of being selected on each draw, and the item is not replaced into the collection, then we can answer these questions by using the hypergeometric distribution (or multivariate hypergeometric for more than two categories of item) and its associated probability mass function.
The difficult jump from question to formula
To solve “hypergeometric-flavour” questions, the basic idea count the number of possible selections given the criteria, then count the total selections of that size (no criteria). We divide the two numbers to get a probability. The formula is:
\[\frac{\binom{K}{k}\binom{N-K}{n-k}}{\binom{N}{n}}\]This gives the probability of seeing exactly $k$ of the $K$ items in the selection of size $n$ (from $N$ total items).
Our question has three possible counts for the kings (our selection is allowed to have 2, 3 or 4) so we can calculate three probabilities separately and sum them:
\[\frac{\binom{4}{2}\binom{52-4}{7-2}}{\binom{52}{7}} + \frac{\binom{4}{3}\binom{52-4}{7-3}}{\binom{52}{7}} + \frac{\binom{4}{4}\binom{52-4}{7-4}}{\binom{52}{7}} = \frac{128}{1547} = 0.083\dots\]By careful addition, subtraction, multiplication, division and calculation of binomial coefficients using the numbers from the question, we get the answer.
While it is very easy to express the question in English, translating it to the mathematical language needed to produce an answer is not always straightforward.
To answer our simple question, we had to extract four numbers and then plug them into various arithmetic operations. We had to know to sum three values separately. In essence we had expand the formula to suit the question.
For collections with multiple kinds of item or more complex constraints (e.g. “at least 2 kings and at most 3 queens and no jacks”) the calculation explodes in size and becomes too difficult for all but the most patient and careful problem solvers.
Calculators
If you search “hypergeometric calculator” online you will find numerous web applications. These calculators let you type numbers from your question into boxes and will handle the computation for you.
These calculators remove the pain of constructing and evaluating the equation. Multivariate hypergeometric calculators are rare: Deck-u-lator is easily the most versatile online calculator I found and had a lot of the functionality I wanted:
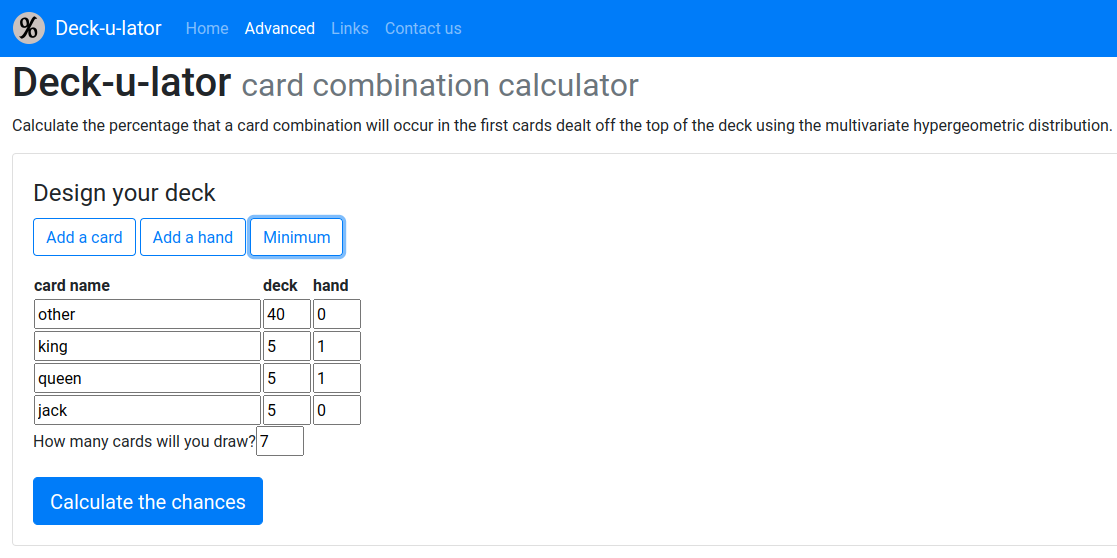
Very nice! I recommend this app.
However, while using this and other online calculators, I found some things that I struggled with and that I thought could be improved upon:
- Question translation: I still have to extract the numbers from my English question and then put the numbers in the correct boxes for every set of constraints. This translation from English to named boxes introduces a gap between expressing the problem and finding the answer. It feels avoidable.
- Question complexity: I want to use multiple constraints or success criteria on items such as “at least 2 kings and exactly 1 jack OR 2 jacks and between 1 and 3 queens”, but this wasn’t particularly easy or natural to express (or even possible in most calculators).
- Calculation capability: I found some calculations to be slow or not work at all, especially for larger collections with particular selection sizes and constraints.
Designing a new calculator
Let’s look at each issue and find a way to address it.
Question translation
I want to avoid having to extract information from my question to feed it to a calculator interface piece by piece. Fundamentally, I don’t think a “numbers in boxes” UI is natural fit for this style of probability question.
Ideally the input should be the question as expressed in English, or something close to English, and the calculator will understand it (as I might do for an LLM-backed chat application, if LLMs weren’t so poor at numerical operations).
Here is the question from above:
Draw 7 cards from a standard deck of 52 cards. What’s the probability we see 2 or more of the 4 kings in the draw?
There are three key pieces of information in this question:
- the size of the draw
- the collection of items that we will draw from
- the constraints on the items we want to see in our draw
These look like ingredients for a query in some query-like language. For example, in SQL a basic query might be written something like this:
SELECT [row values under some column names]
FROM [table]
WHERE [row values satisfy some criteria]
These basic queries are close to English (even if you’re not a SQL user you can probably understand what they do), but they are also rigid enough for a computer to interpret without ambiguity.
Our probability question above can be rewritten to have this structure:
PROBABILITY DRAW 7
FROM king = 4, other = 48
WHERE king >= 2
More generally the structure is:
PROBABILITY DRAW [some number of items]
FROM [collection of items]
WHERE [items in draw satisfy some criteria]
Using this approach we can express our questions in quite a natural way.
We don’t need to extract information from the query and translate it for the calculator interface. The calculator can use the numbers and items names in the correct parts of whatever computation needs to happen.
Question complexity
With the idea of using a query-like language, expressing more complicated problems follows easily.
First, we just list what’s in our collection (the FROM clause), so we can easily add more items:
PROBABILITY DRAW 7
FROM king = 4, queen = 4, jack = 4, other = 40
WHERE king >= 2
Second, as in other query languages, we can use AND and OR to expand the constraints on what we want in our selection (the WHERE clause):
PROBABILITY DRAW 7
FROM king = 4, queen = 4, jack = 4, other = 40
WHERE king >= 2 AND queen <= 3 AND jack = 0
   OR king = 3 AND jack = 2 AND queen = 0
The use of OR gives us much more flexibility and opens up a wider range of problems our calculator can understand. Importantly, the input still resembles how we might pose the problem in English.
It’s easy to imagine how this language can be extended to express more complex constraints, e.g.:
...
WHERE
  king < queen              -- fewer kings than queens
  jack IS EVEN              -- even number of jacks
  king + queen + jack >= 5  -- 5 or more kings, queens and jacks
Calculation capability
The calculator has received its input from us and has parsed the expression. Data is stored in some internal representation of the calculation to be performed.
# Rough example of storing input in Python-like code.
from dataclasses import dataclass

@dataclass
class Calculation:
    draw_size: int
    collection: dict[str, int]
    draw_criteria: dict[str, list[int]]
Let’s look at a question where we have more than two kinds of item.
PROBABILITY DRAW 7
FROM king = 4, queen = 4, jack = 4, other = 40
WHERE king >= 2 AND queen <= 3 AND jack = 0
We’d store this query as:
calc = Calculation(
    draw_size=7,
    collection={
        "king": 4,
        "queen": 4,
        "jack": 4,
        "other": 40,
    },
    draw_criteria={
        "king": [2, 3, 4],
        "queen": [0, 1, 2, 3],
        "jack": [0],
    },
)
We need to pass this object as the input to some algorithm to generate the correct answer.
Statistics libraries
To begin, let’s look at using the statistical functions from a library such as SciPy.
The king must be seen 2, 3 or 4 times in our draw. The queen must be seen 0, 1, 2 or 3 times. The jack must appear 0 times. The other items must therefore be equal to $7 - \left(\text{king} + \text{queen} + \text{jack}\right)$. We need to find all item counts for possible draws:
import itertools

king_queen_jack = itertools.product(
    calc.draw_criteria["king"],
    calc.draw_criteria["queen"],
    calc.draw_criteria["jack"],
)

draws = [x + (calc.draw_size - sum(tup),) for x in king_queen_jack]
This gives 12 possible draw values (each row sums to 7):
[(2, 0, 0, 5),
 (2, 1, 0, 4),
 (2, 2, 0, 3),
 (2, 3, 0, 2),
 (3, 0, 0, 4),
 (3, 1, 0, 3),
 (3, 2, 0, 2),
 (3, 3, 0, 1),
 (4, 0, 0, 3),
 (4, 1, 0, 2),
 (4, 2, 0, 1),
 (4, 3, 0, 0)]
We use give this array of draws to the SciPy function multivariate_hypergeom and sum the array of probabilities it returns for each row:
from scipy import stats

stats.multivariate_hypergeom.pmf(
    draws,
    calc.collection.values(),
    calc.collection.draw_size,
).sum()
The answer is $0.0528615\dots$. Using functions from statistical libraries is fast and doesn’t require us to write any particularly difficult code.
The library functions have some limitations though. First, generating large list or arrays of integers is slow and requires a lot of memory when item counts can range over many values. Second, probabilities can only be calculated as float values, not rational numbers. This is fine for not-too-small probabilities, but we’ll lose some precision when computing and comparing small values. Third, we can only generate the probability for a single draw size at a time and cannot easily reuse parts of our computation.
Explicit loops and sums
Another approach is to construct the multivariate hypergeometric probability mass function and use nested sums over the possible item counts (somewhat equivalent to a nested-for loop). This would allow probabilities to computed as rational numbers, keeps memory usage lower, and makes it easier for us to reuse parts of a computation:
The Deck-u-later app seems to take this approach based on the formula it shows the user. However, for collections with many types of item it can be extremely slow (see Why are some calculations slow?) as it computes the probability for all item choices using combinations with replacement.
There’s another approach that I think will solve this latter issue.
Polynomials
Instead of making an array of possible counts or summing over counts for each item, we can represent each item in can take in a draw that meets the criteria as a polynomial.
The degree of each monomial is the number of times it can be chosen in a draw meeting the criteria. The coefficient of $x^n$ is the number of ways a draw of size $n$ can be chosen. For example, the king can be drawn 2, 3 or 4 times:
\[\binom{4}{2}x^2 + \binom{4}{3}x^3 + \binom{4}{4}x^4\]If we multiply the polynomials for each item together, the coefficients in the expanded polynomial tell us the number of ways a draw of a particular size can occur:
\[\begin{align} \left(\binom{4}{2}x^2 + \binom{4}{3}x^3 + \binom{4}{4}x^4\right) \nonumber \tag{king}\\ \left(1 + \binom{4}{1}x + \binom{4}{2}x^2 + \binom{4}{3}x^3\right) \nonumber \tag{queen}\\ \left(1 + \binom{40}{1}x + \dots + \binom{40}{5}x^{5}\right) \nonumber \tag{other} \end{align}\]This is essentially a factorisation of the numerator of the summed multivariate hypergeometric probability mass function and expands to the polynomial:
\[2632032x^{12} + 14841736x^{11} + 36266516x^{10} + \\ 39847184x^9 + 23798974x^8 + 7072052x^7 + \\ 868422x^6 + 83292x^5 + 5853x^4 + 268x^3 + 6x^2\]Now for a draw size of 7, we can extract the coefficient of $x^7$ and then use it to compute the probability:
\[\frac{7072052}{\binom{52}{7}} = \frac{136001}{2572780} = 0.0528615\dots\]As well as rational values, we get the counts and probabilities for all draw sizes at the same time.
For large draw ranges the polynomials will also be large, but efficient algorithms for polynomial multipliaction are known (e.g. using the Fast Fourier Transform).
I used SymPy for the calculation above. For larger draws from larger collections the polynomial method was faster than the SciPy approach above, and even faster if SymPy uses gmpy2. For instance, with a collection containing 12 types of item with 5 cards each (60 items) and seeing at least 1 for each item from 30 draws returned the probability $0.71255$ instantly, whereas the online calculator approach would potentially take many hours.
I will use the polynomial method in my calculator.
How to write the code
The two key ideas around the user input and the computation method need to be implemented and joined up.
As I’m just writing a proof-of-concept program, I’ll make a CLI application instead of browser-based UI. I’ll write it in Python as I’m familiar with the language for making CLIs and I have in mind the key libraries I want to use:
- lark: for defining and parsing the query language (I’ve been meaning to try this library out for a while).
- sympy: mentioned above, SymPy is a computer algebra library and more than capable of polynomial multiplication.
I’ll write a simple interpreter shell where the user can type the input and see the result using the Python standard library’s cmd module. Finally, I want to be able to show the probabilities to the user in the form of a table and a plot so I’ll use tabulate and uniplot.
The structure of the program and flow of data through the code is relatively straightforward. The basic components are outlined below.
1. Define the grammar
The grammar for the query language goes in a file (grammar.lark). Lark reads this file and builds a parser for user input. The grammar looks a bit like this:
%import common.CNAME -> NAME
%import common.INT -> NUMBER
%import common.WS
%ignore WS

start: computation

computation: "PROBABILITY" "DRAW" selection_size "FROM" collection
             "WHERE" constraints ";" -> prob_draw

selection_size: NUMBER             -> selection_size_int
              | NUMBER ".." NUMBER -> selection_size_range

collection: (collection_item) ("," collection_item)* -> collection
collection_item: NAME "=" NUMBER -> collection_item

constraints: and_constraints ("OR" and_constraints)* -> constraints
and_constraints: (constraint_count) ("AND" constraint_count)*
constraint_count: NAME "="  NUMBER -> constraint_eq
                | NAME "<"  NUMBER -> constraint_lt
                | NAME ">"  NUMBER -> constraint_gt
                | NAME "<=" NUMBER -> constraint_le
                | NAME ">=" NUMBER -> constraint_ge
That’s all we need to parse our query:
PROBABILITY DRAW 7
FROM king = 4, queen = 4, jack = 4, other = 40
WHERE king >= 2;
2. Parse user input to a tree structure
User input is a string. Give it to the Lark parser to build a ParseTree.
parser = lark.Lark.open("grammar.lark", rel_to=__file__)
tree = parser.parse(user_query)
3. Walk the tree, organise the data
Now we visit the nodes of the tree, storing the data for the computation we need to do in a ComputationDescription object (collection items, draw constraints, etc.).
Lark offers a couple of classes to do this: the Transformer class visits the nodes of the tree (from the leaves to the root by default) and can also modify or discard parts of the tree which can simplify processing.
In our subclass, every ... -> node_name in the grammar file is a method on the class that defines how the node is processed.
@lark.v_args(inline=True)
class BuildComputation(lark.Transformer):

    def __init__(self):
        super().__init__()
        self.computation = ComputationDescription()

    @lark.v_args(tree=True)
    def collection(self, tree):
        self.computation.collection = dict(tree.children)
        return lark.Discard

    @lark.v_args(tree=True)
    def constraints(self, tree):
        self.computation.constraints = tree.children
        return lark.Discard

    def selection_size_int(self, size):
        self.computation.selection_range = range(size, size+1)
        return lark.Discard

    # ...and so on
The @lark.v_args decorator changes the arguments the method recieves (do we want the whole subtree, or the terminal arguments?)
4. Do the computation
We’ll validate the ComputationDescription first (are all the constrained items in the collection? etc.) and then we’re ready for the computation.
This involves generating polynomials for each item in our draw, finding the product of these polynomials, and extracting an array of coefficients.
from collections.abc import Collection, Mapping

from sympy import Poly, binomial, prod, Rational
from sympy.abc import x

def degrees_to_poly_with_binomial_coeff(degrees: Collection[int], n: int) -> Poly:
    """For each degree `d`, create the polynomial with terms
    of degree `d` having binomial coefficient `bin(n, d)` where
    `n` is the total number of the item:

        {0, 2, 5} -> bin(n, 5)*x**5 + bin(n, 2)*x**2 + 1

    """
    coeffs = {degree: binomial(n, degree) for degree in degrees}
    return Poly.from_dict(coeffs, x)


def evaluate(computation: ComputationDescription) -> list[Rational]:
    """
    Figure out constraints on each item count in legal from `ComputationDescription.collection`.
    Make polynomials for `ComputationDescription.collection`.
    Multiply polynomials to get all possible counts.
    Extract coefficients according to `ComputationDescription.selection_size`.
    Convert counts to probabilities/rational numbers as needed.
    """
    ...
5. Show the result
The array of coefficients we extract from the polynomial are the numbers we want to show to the user as the answer.
With the array, we can either produce a table or plot a graph.
The finished calculator
I’ve called the project “urn”. The source code is available here. You can install the calculator using:
pip install urn-calculator
To use it, type urn to get the shell and enter the input:
urn> PROBABILITY DRAW 7
...  FROM other=40, king=4, queen=4, jack=4
...  WHERE king >= 2 AND queen <= 3 AND jack = 0;

  draw size    probability
-----------  -------------
          7      0.0528615
Use SHOW PLOT and omit the draw count to see a plot of all possible (non-zero probability) draw sizes:
urn> PROBABILITY DRAW
...  FROM other=40, king=4, queen=4, jack=4
...  WHERE king >= 2 AND queen <= 3 AND jack = 0
...  SHOW PLOT;
┌────────────────────────────────────────────────────────────┐
│             ▖▝ ▘▘▝ ▖                                       │
│            ▘        ▖                                      │
│          ▝           ▝                                     │
│         ▖              ▘                                   │
│                         ▘                                  │
│        ▘                 ▝                                 │
│                            ▘                               │
│      ▝                      ▖                              │ 0.1
│     ▖                        ▗                             │
│                               ▗                            │
│    ▖                            ▖                          │
│                                  ▗                         │
│  ▗                                ▝                        │
│                                     ▘▗                     │
│ ▖                                     ▗                    │
│                                         ▘▝▗                │
│▘▁▁▁▁▁▁▁▁▁▁▁▁▁▁▁▁▁▁▁▁▁▁▁▁▁▁▁▁▁▁▁▁▁▁▁▁▁▁▁▁▁▁▁▁▘▝▗▁▖▗▗▁▖▗▗▁▖▗▗│ 0.0
└────────────────────────────────────────────────────────────┘
          10            20           30           40
I added the ability for drawing without replacement too (the multinomial distribution). There is more info in the README on GitHub.
I think this calculator turned out well and I use it for my own questions. Feedback and contributions are always welcome!